Stop bleeding $5K-$50K per month to dead stock and stock-outs.
Forecasts demand across every SKU. Flags dead inventory before it rots. Recommends reorder points and quantities. Runs price elasticity analysis on your entire catalog. Grades its own forecasts with MAPE and gets smarter every month.
You're overstocked and out of stock at the same time.
Your warehouse has $40K of parts that haven't moved in 18 months. And the parts you stocked out on three times this month cost you real sales. Your inventory manager can't stare at 40,000 SKUs every day. So you overstock the wrong stuff and understock the right stuff, bleeding margin at both ends.
Inventory carrying cost runs 25-30% annually. Dead stock on 10% of your SKUs at a $3M shop represents $75K-$120K of capital tied up in parts nobody wants. Meanwhile stockouts on fast-movers push customers to your competitors, and they often don't come back.
The pricing side is worse. Most shops have 300-500 SKUs they're underpricing relative to demand elasticity, leaving $30K-$80K of margin on the table every year. Nobody in your shop has time to figure out which ones. So the money stays on the table.
It reads the same shelf your buyer does.
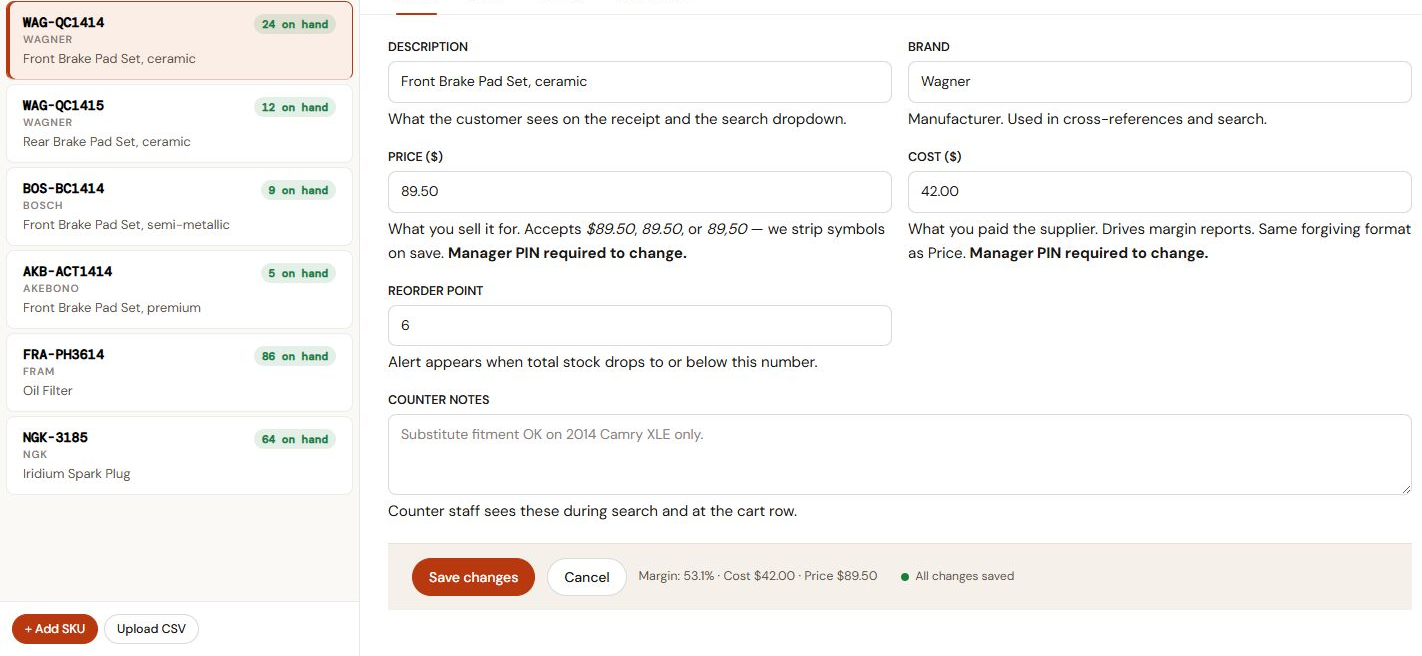
Live from the platform: every SKU with on-hand counts, reorder points, cost, price, and margin. The agent's forecasts start from this screen.
Every SKU, every day, reasoned about.
Demand forecast by SKU and location
Uses your historical order data to forecast next-30-day demand for every part at every branch. Seasonal patterns, trend shifts, and one-off spikes handled separately.
Dead-stock early warning
Flags slow-moving SKUs 90 days before they cross your "dead" threshold. Your buyer can act before the capital is trapped.
Smart reorder recommendations
Reorder points and quantities tailored to lead times, service-level targets, and demand variability. Not rules of thumb.
Price elasticity analysis
Identifies SKUs you're underpricing (demand is inelastic, raise price) and SKUs you're overpricing (killing demand, drop it). Dollars identified in annualized terms.
MAPE-graded, self-improving
Mean Absolute Percentage Error tracked on every forecast. Underperforming models retrained automatically. The agent gets smarter every month.
Buyer dashboard, readable in 5 minutes
Not a data science notebook. A clean page showing this week's reorder list, this week's dead-stock alerts, and this week's pricing opportunities. Your buyer reads it over coffee.
A composite $3M shop, 90 days after deployment.
- Reorder decisions based on gut feel and last month's sales
- Dead stock discovered quarterly via physical inventory count
- Prices updated annually, if at all
- Stockouts happen, get fixed reactively
- Buyer spends 15+ hrs/week on routine reorder math
- Forecast accuracy: whoever happened to do it
- Daily forecasts per SKU and location, updated automatically
- Dead stock flagged 90 days before it rots
- Prices updated monthly based on elasticity data
- Stockouts predicted and prevented
- Buyer spends 15+ hrs/week on strategy, not math
- MAPE-tracked accuracy, improves every month
An illustrative scenario built from industry benchmarks. Your numbers will vary.
Reads from your ERP. Shares data with the rest of the stack.
The Inventory Agent uses the same ERP connection as the Counter Agent. Every quote, sale, and stock movement flows into its forecasting engine. The Vendor Agent picks up reorder recommendations and converts them to RFQs. The data loop closes by itself.
Typical deployment order: Counter Agent first, Inventory Agent 30-60 days later once the data pipe is warm and the forecasting engine has enough history to calibrate against your shop's reality.
Get started free today.
Get your AI agent live without a card. Prefer white-glove setup for a multi-store group or ERP integration? Book a call instead.
 AutoPartsAgent
The AI parts counter. Answers calls, decodes VINs, and quotes from real inventory, 24/7.